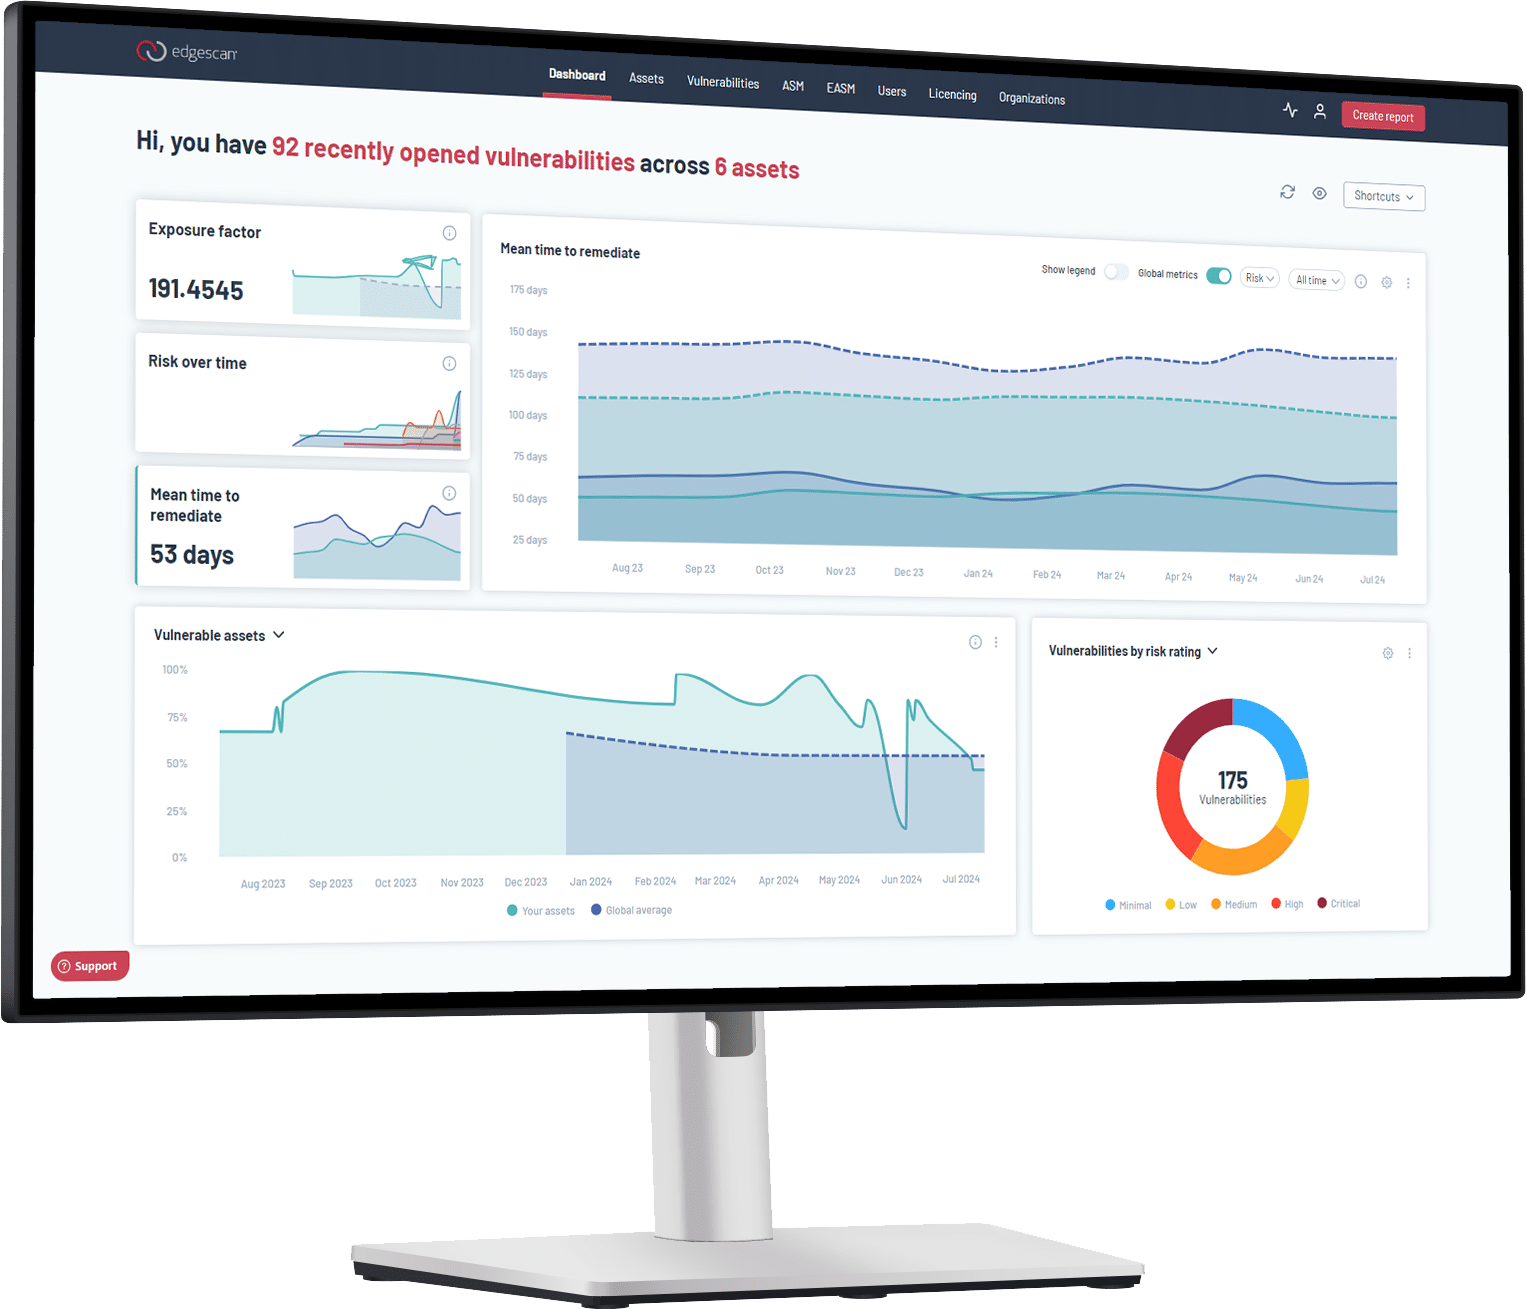
Some of our clients use the Edgescan platform as their touchstone of truth for their VM program, perpetually inside the dashboard. Others hardly ever sign in.
That is not a complaint. It is how our platform was designed.
Security teams already have a place where they look at everything. Whether it’s a SIEM or a bespoke tool, that’s their system of record. Adding one more login to their morning is asking them to do something they won’t keep doing for long.
So when you are evaluating a vendor, consider how that data can be integrated into your existing workflows, not just how aesthetically pleasing the UI might be.
Almost anything you can do in the platform, you can do via the API
API-first is a phrase that gets used loosely, so here is what it means for us. Everything you can do in the interface, you can do programmatically. Expertly validated testing results can all be pulled out and used somewhere else.
Authentication is token-based. Responses are paginated, which matters more than it sounds when you’re pulling a large datasets for the first time.
Where the data usually goes
In CI/CD, that means Azure Pipelines, GitHub Actions, and Jenkins, plus a generic path for anything that can accept Docker commands. Teams use it to trigger assessments or gate a build on validated findings before code ships.
In ticketing, it’s Jira Cloud, Jira Data Center, ServiceNow, and Freshworks. Findings become tickets in the queue the developers already work from. That’s the difference between a vulnerability being reported and a vulnerability being assigned.
For detection, correlation, and vulnerability management, validated findings feed into Splunk, Azure Sentinel, Cortex XSOAR, DefectDojo, Kenna Security, and Axonius. For alerting, Teams and Slack.
Everything routed downstream has been validated first, either automatically against our vulnerability data lake or by one of our analysts. What lands in your ticketing system is a finding somebody has already stood behind, rather than unvalidated tool output waiting on somebody to triage it.
Time to Update your Stale Cloud Asset Inventory
Ephemeral infrastructure breaks the usual idea of an asset inventory. A public cloud IP you release in the morning can be assigned to an unrelated tenant the same day, and a scan pointed at it is testing a stranger’s infrastructure.
Edgescan’s Cloudhook integrates with AWS, Microsoft Azure, and Google Cloud, and tracks deployments by tag rather than by address. As addresses spin up and down, assets are created and deactivated automatically to match.
That keeps the picture accurate in both directions. You are not testing infrastructure you no longer own, and you are not blind to infrastructure that showed up last week.
That could make the difference between an inventory that reflects today and one that reflects last quarter.
Notifications, and why granularity is the point
A dozen event types can trigger a notification. Assessments starting and completing, vulnerabilities opening and closing, hosts being discovered or going down, ports opening and closing, notes being added, credentials being added, asset blocker events, and SLA violations.
Each one scopes to all assets, selected assets, or a tag, with display options controlling how much detail the notification carries. Vulnerability events filter by minimum risk level. Port events filter by protocol and range.
That combination is what makes it usable at scale. A high-risk vulnerability opening on a tagged production asset can go straight to a Slack channel and raise a ticket in Jira. An SLA breach can email the asset owner and raise a SIEM event. Nobody gets alerted about a low-severity finding on a staging box.
Webhooks accept a custom URL, HTTP method, and headers, with an SSL validation toggle, plus native Slack and Microsoft Teams formats. So when we don’t have a prebuilt connector for something you run, the webhook is how you connect it anyway.
Reporting for people who don’t want a dashboard either
Executives generally do not want a login. They want a document, and they want it to land in their inbox without anyone having to produce it for them.
Reports come in three layouts, from an executive summary through to exhaustive technical detail, plus dedicated PCI and attack surface templates. They can be generated on demand or on a schedule; downloaded in a browser, or sent via email. Reporting periods run from the previous week up to a year, or a custom range.
Sections are selectable, so an executive report and an engineering handoff come from the same data without either audience having to read the other one’s report.
None of this is revolutionary
There is nothing in here a large enterprise would not consider table stakes. We know that.
What is surprising is how many vendors still cannot do it. When security data cannot reach the tools a team already works in, somebody ends up moving findings between systems by hand. That person becomes the integration, and they are usually the one who can least afford the time.
Tell us what tools your team is already using and we will map the integrations and workflows required to seamlessly compliment your current stack.